Data story
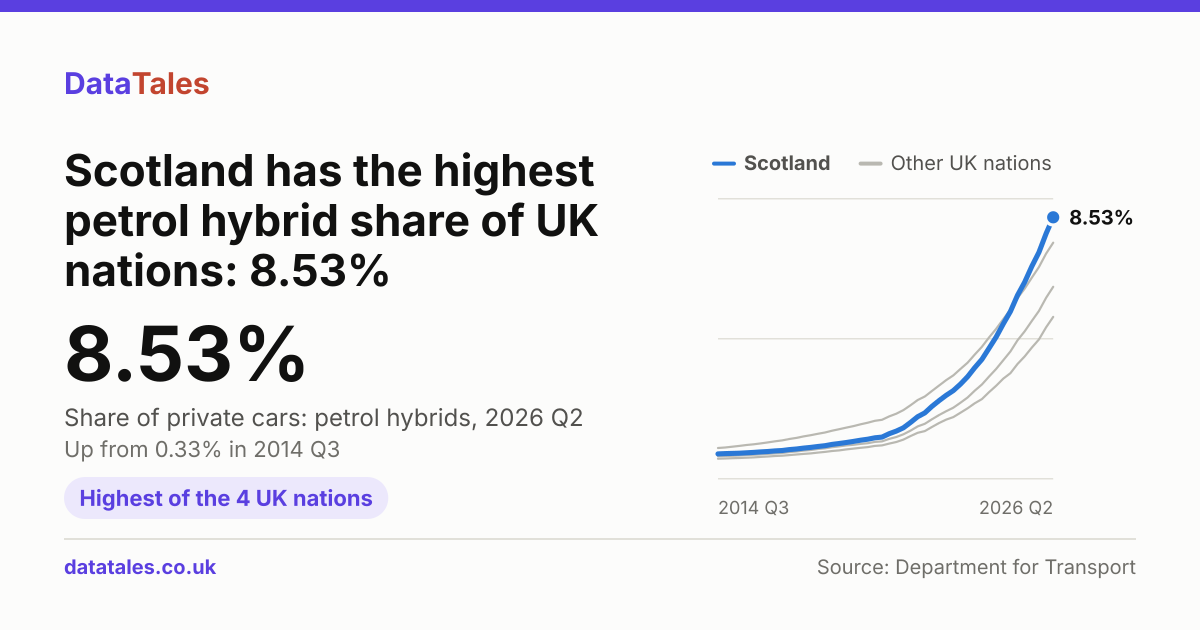
Scotland has the highest petrol hybrid share of UK nations: 8.53%
Data covers 2014 Q3 to 2026 Q2
At the end of June 2026, 8.53% of Scotland's privately kept cars were petrol hybrids, up from 0.33% in 2014 Q3.
Petrol hybrids as a share of private cars, by UK nation
% of privately kept cars
Share of privately kept cars that are petrol hybrids, end of each quarter. Source: DfT vehicle licensing statistics.
Line chart: Petrol hybrids as a share of private cars, by UK nation (% of privately kept cars). It shows 4 areas from 2014 Q3 to 2026 Q2. Scotland, highlighted, rose from 0.33% in 2014 Q3 to 8.53% in 2026 Q2. In 2026 Q2 it was the highest of the 4. Shown in grey: England rose from 0.53% in 2014 Q3 to 7.65% in 2026 Q2, Northern Ireland rose from 0.16% in 2014 Q3 to 5.08% in 2026 Q2 and Wales rose from 0.24% in 2014 Q3 to 6.12% in 2026 Q2.
Petrol hybrid share: start and end of the series
% of privately kept cars
Every nation rose; Scotland moved from behind England to the top.
Slope chart: Petrol hybrid share: start and end of the series (% of privately kept cars). It compares 2014 Q3 with 2026 Q2 for 4 areas. Scotland, highlighted, rose from 0.33% in 2014 Q3 to 8.53% in 2026 Q2. In 2026 Q2 it was the highest of the 4. Shown in grey: England rose from 0.53% in 2014 Q3 to 7.65% in 2026 Q2, Northern Ireland rose from 0.16% in 2014 Q3 to 5.08% in 2026 Q2 and Wales rose from 0.24% in 2014 Q3 to 6.12% in 2026 Q2.
Petrol hybrid share by nation, latest quarter
% of privately kept cars
Share of privately kept cars that are petrol hybrids.
Map: Petrol hybrid share by nation, latest quarter (% of privately kept cars), 2026 Q2. Scotland, outlined, 8.53%. Values range from 5.08% in Northern Ireland to 8.53% in Scotland; a stronger colour means a higher value. Northern Ireland 5.08%, Wales 6.12%, England 7.65% and Scotland 8.53%. Areas without data are grey.
The data
Download CSV| Period | Scotland | England | Northern Ireland | Wales |
|---|---|---|---|---|
| 2014 Q3 | 0.33 | 0.53 | 0.16 | 0.24 |
| 2014 Q4 | 0.34 | 0.55 | 0.17 | 0.25 |
| 2015 Q1 | 0.34 | 0.58 | 0.18 | 0.26 |
| 2015 Q2 | 0.35 | 0.60 | 0.19 | 0.27 |
| 2015 Q3 | 0.37 | 0.63 | 0.20 | 0.28 |
| 2015 Q4 | 0.38 | 0.66 | 0.21 | 0.29 |
| 2016 Q1 | 0.40 | 0.69 | 0.22 | 0.31 |
| 2016 Q2 | 0.41 | 0.73 | 0.24 | 0.33 |
| 2016 Q3 | 0.43 | 0.77 | 0.25 | 0.34 |
| 2016 Q4 | 0.45 | 0.79 | 0.26 | 0.36 |
| 2017 Q1 | 0.48 | 0.84 | 0.29 | 0.39 |
| 2017 Q2 | 0.50 | 0.88 | 0.31 | 0.41 |
| 2017 Q3 | 0.53 | 0.93 | 0.33 | 0.44 |
| 2017 Q4 | 0.55 | 0.98 | 0.35 | 0.46 |
| 2018 Q1 | 0.58 | 1.03 | 0.37 | 0.50 |
| 2018 Q2 | 0.61 | 1.07 | 0.39 | 0.52 |
| 2018 Q3 | 0.66 | 1.13 | 0.43 | 0.56 |
| 2018 Q4 | 0.69 | 1.18 | 0.45 | 0.59 |
| 2019 Q1 | 0.72 | 1.24 | 0.48 | 0.62 |
| 2019 Q2 | 0.76 | 1.29 | 0.51 | 0.64 |
| 2019 Q3 | 0.80 | 1.35 | 0.54 | 0.67 |
| 2019 Q4 | 0.84 | 1.41 | 0.56 | 0.70 |
| 2020 Q1 | 0.89 | 1.47 | 0.61 | 0.74 |
| 2020 Q2 | 0.91 | 1.51 | 0.62 | 0.76 |
| 2020 Q3 | 1.03 | 1.63 | 0.68 | 0.85 |
| 2020 Q4 | 1.12 | 1.72 | 0.74 | 0.91 |
| 2021 Q1 | 1.23 | 1.85 | 0.82 | 1.01 |
| 2021 Q2 | 1.42 | 2.01 | 0.95 | 1.13 |
| 2021 Q3 | 1.62 | 2.20 | 1.06 | 1.28 |
| 2021 Q4 | 1.75 | 2.32 | 1.12 | 1.37 |
| 2022 Q1 | 1.97 | 2.51 | 1.26 | 1.53 |
| 2022 Q2 | 2.17 | 2.70 | 1.40 | 1.67 |
| 2022 Q3 | 2.36 | 2.89 | 1.52 | 1.81 |
| 2022 Q4 | 2.52 | 3.05 | 1.60 | 1.93 |
| 2023 Q1 | 2.75 | 3.27 | 1.76 | 2.10 |
| 2023 Q2 | 3.00 | 3.49 | 1.91 | 2.28 |
| 2023 Q3 | 3.31 | 3.77 | 2.08 | 2.52 |
| 2023 Q4 | 3.60 | 4.04 | 2.23 | 2.73 |
| 2024 Q1 | 3.99 | 4.36 | 2.47 | 3.01 |
| 2024 Q2 | 4.38 | 4.66 | 2.69 | 3.27 |
| 2024 Q3 | 4.84 | 5.00 | 2.94 | 3.58 |
| 2024 Q4 | 5.26 | 5.32 | 3.13 | 3.88 |
| 2025 Q1 | 5.83 | 5.73 | 3.44 | 4.27 |
| 2025 Q2 | 6.28 | 6.06 | 3.71 | 4.58 |
| 2025 Q3 | 6.83 | 6.44 | 4.01 | 4.94 |
| 2025 Q4 | 7.32 | 6.80 | 4.30 | 5.28 |
| 2026 Q1 | 7.97 | 7.27 | 4.72 | 5.74 |
| 2026 Q2 | 8.53 | 7.65 | 5.08 | 6.12 |
- 8.53%Share of private cars: petrol hybrids, 2026 Q2From 0.33% in 2014 Q3
- 5.66%Share of private cars: other fuel types, 2026 Q2From 0.13% in 2014 Q3
- 27.74%Share of private cars: diesel, 2026 Q2From 34.47% in 2014 Q3
Petrol hybrids made up 8.53% of privately kept cars in Scotland at the end of June 2026, the highest share of the four UK nations. At the end of September 2014 the figure was 0.33%. That is a rise of 8.20 percentage points between 2014 Q3 and 2026 Q2, the biggest rise of the four nations. The figures come from the Department for Transport’s Vehicle licensing statistics (VEH tables) and cover each quarter from 2014 Q3 to 2026 Q2.
The climb was gradual at first. By 2020 Q2 the share stood at 0.91%. After that, the quarterly increases grew steadily larger. Between 2021 Q1 and 2021 Q2 the share went from 1.23% to 1.42%, a rise of 0.18 percentage points. By 2024 Q1 it had reached 3.99%. Between 2025 Q4 and 2026 Q1 it rose by 0.65 percentage points, from 7.32% to 7.97%, and the latest quarter added a further 0.57 percentage points. The share rose in every quarter in each of the four nations, so Scotland’s latest figure of 8.53% is also its peak.
How it compares
All four nations rose between 2014 Q3 and 2026 Q2. England started ahead of Scotland, at 0.53% in 2014 Q3, and reached 7.65% in 2026 Q2. That means Scotland moved from behind England to the top over the period. Wales went from 0.24% to 6.12%, and Northern Ireland from 0.16% to 5.08%. Northern Ireland had the lowest share at both ends of the series. Because these are exact counts rather than samples, the gaps between the nations are real differences.
Other fuel groups in the same DfT table point the same way in Scotland. The share of private cars on other fuel types, which includes fully electric cars, rose from 0.13% in 2014 Q3 to 5.66% in 2026 Q2, up 5.53 percentage points. On that measure Scotland climbed from third to second of the four nations, overtaking Wales, which went from 0.20% to 4.07%.
Diesel moved the other way. Its share of Scotland’s private cars peaked at 40.50% in 2018 Q4 and has fallen since; the latest figure, 27.74% in 2026 Q2, is well below that peak, by 12.75 percentage points. Compared with 34.47% in 2014 Q3, that is a fall of 6.73 percentage points, or 19.52% in relative terms. The diesel line held close to its high point through 2019 and early 2020 before the decline set in.
What the data can’t tell us
These figures are administrative counts of licensed vehicles, not survey estimates, so they carry no margin of error. Changes smaller than 2.00% are treated as no real change, which does not affect the large shifts described here.
The counts cover licensed cars kept by private individuals at the end of each quarter, so a figure for the April to June quarter is the position at the end of June. Company cars are left out, because DfT counts them at the company’s registered address, which for leasing and rental fleets is often far from where the cars are used. Cars are also counted at the registered keeper’s postcode, which is not necessarily where they are driven.
In this table DfT groups fuel as petrol, diesel, petrol hybrid and other fuel types. The other fuel types group covers everything else, including fully electric cars, which DfT publishes in more detail in a separate table. The series starts in 2014 Q3 because that is the first quarter the table covers the whole UK, including Northern Ireland.
Finally, the data shows which cars are licensed, not how far they are driven or why people chose them. It cannot explain what caused Scotland’s faster switch, whether prices, incentives, charging access or the mix of cars on offer.